My first English paper was finally online on PeerJ which I began to prepare since November 2009. I have to admit that it is not an easy job to write a scientific paper for a junior scientist, such a person as I am. A big thank you to my collaborator, Roland Kays, for your substantial contributions to this paper!
Here is the abstract in our paper How long is enough to detect terrestrial animals? Estimate the minimum trapping effort on camera traps:
Camera traps is an important wildlife inventory tool for estimating species diversity at a site. Knowing what minimum trapping effort is needed to detect target species is also important to designing efficient studies, considering both the number of camera locations, and survey length. Here, we take advantage of a two-year camera trapping dataset from a small (24-ha) study plot in Gutianshan National Nature Reserve, eastern China to estimate the minimum trapping effort actually needed to sample the wildlife community. We also evaluated the relative value of adding new camera sites or running cameras for a longer period at one site. The full dataset includes 1727 independent photographs captured during 13,824 camera days, documenting 10 resident terrestrial species of birds and mammals. Our rarefaction analysis shows that a minimum of 931 camera days would be needed to detect the resident species sufficiently in the plot, and c. 8700 camera days to detect all 10 resident species. In terms of detecting a diversity of species, the optimal sampling period for one camera site was c. 40, or long enough to record about 20 independent photographs. Our analysis of evaluating the increasing number of additional camera sites shows that rotating cameras to new sites would be more efficient for measuring species richness than leaving cameras at fewer sites for a longer period.
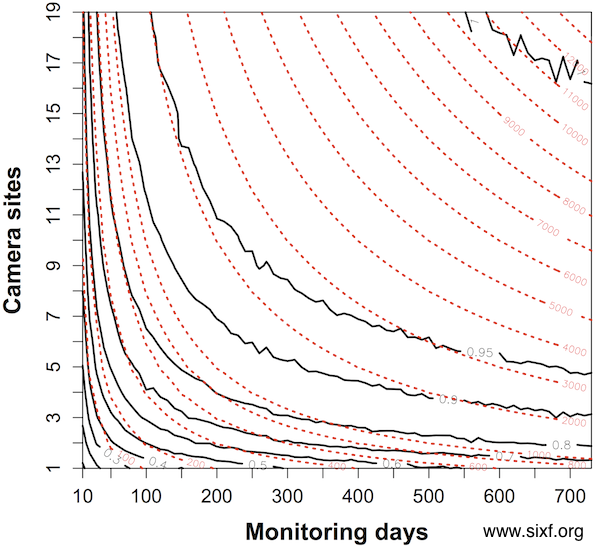
The key point is the following contour figure, which
evaluated the relative value of adding more camera sites or more monitoring days in a survey of species diversity. The black bold lines are the proportion of the total species pool (n = 10) detected. The red dashed lines show the contour lines of the trapping effort (camera days). The proportion of species detected is mean values resampled 1000 times from a dataset of 19 camera sites running for two years. It showed, given the same trapping effort, it was better to deploy cameras across more sites for a shorter time at each site, than to leave cameras at the same site. See details in the text.