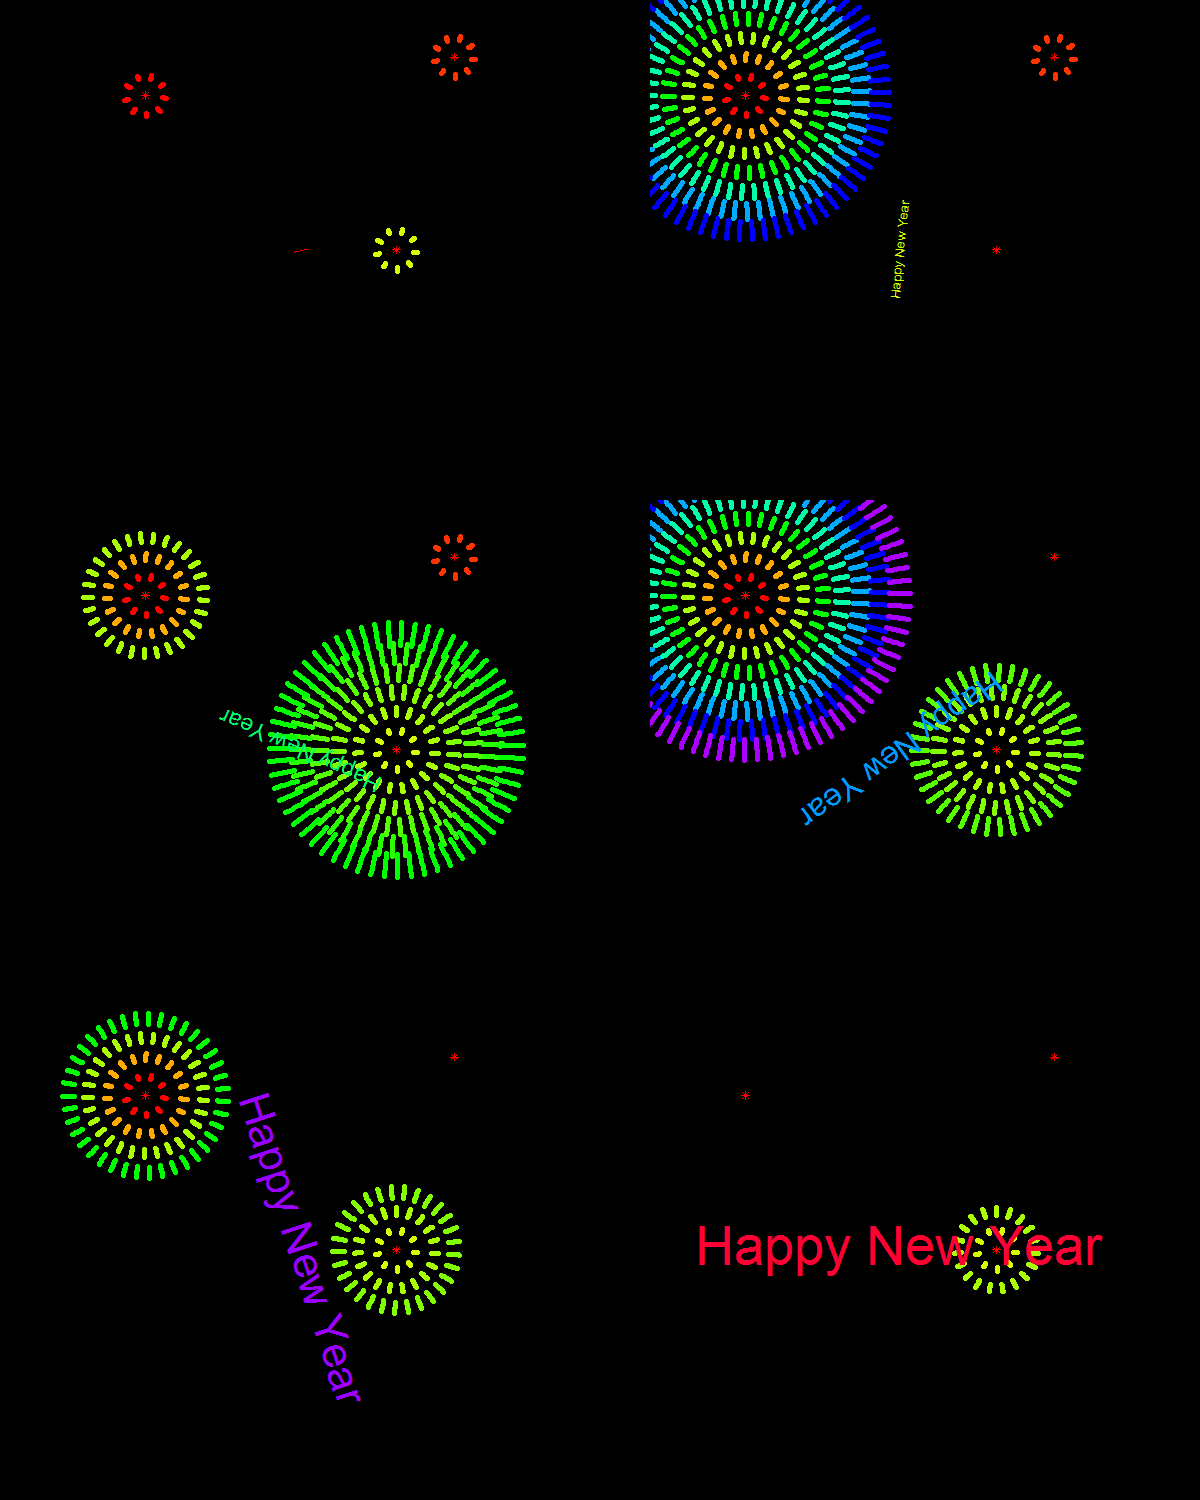
When I am sitting in front of my Mac this morning, and listening the fireworks exploding out of the window, I am sure it is the time to welcome the Chinese New Year of 2015. As I deeply depend on R programme for statistical analyses, it will be the best way to deliver my new year’s wish created by R.
Last week, I found the animation package in R programme by Yihui Xie published in Journal of Statistical Software that provides many amazing ideas on demonstrating animations of statistics. Here, I used some simple code in animation package to present my wish. The animation shows as below:

To generate this animation, just run the code in the following three steps:
- Open the R console, and install the animation package:
install.packages('animation') - Load the animation package:
library(animation) - Run the demonstration code of the fireworks:
demo('fireworks')
You will receive three documents (named image, css, and js) and a webpage file (fireworks.html) in your working directory (show the working directory of your R programm by typing: getwd()). Open the webpage file by any web browser, such as Internet Explorer, Chrome, or Safari, and the animation will come out.
Happy New Year for all!
The detailed code for demo('fireworks') are as below.
## Fireworks demo by Weicheng Zhu
library(animation)
library(picante)
library(nlme)
library(FD)
library(vegan)
library(permute)
library(geometry)
library(magic)
library(abind)
library(ape)
library(ade4)
fire <- function(centre = c(0, 0), r = 1:5, theta = seq(0,
    2 * pi, length = 100), l.col = rgb(1, 1, 0), lwd = 5,
    ...) {
    x <- centre[1] + outer(r, theta, function(r, theta) r *
        sin(theta))
    y <- centre[2] + outer(r, theta, function(r, theta) r *
        cos(theta))
    matplot(x, y, type = "l", lty = 1, col = l.col, add = T,
        lwd = lwd, ...)
}
f <- function(centre = rbind(c(-7, 7), c(7, 6)), n = c(7,
    5), N = 20, l.col = c("rainbow", "green"), p.col = "red",
    lwd = 5, ...) {
    ani.options(interval = 0.1)
    lwd = lwd
    if (is.vector(centre) && length(n) == 1) {
        r = 1:n
        l = seq(0.1, 0.6, length = n)
        matplot(centre[1], centre[2], col = p.col, ...)
        for (r in r) {
            fire(centre = centre, r = seq(r - l[r], r + l[r],
              length = 10), theta = seq(0, 2 * pi, length = 10 *
              r) + 1, l.col = rainbow(n)[r], lwd = lwd, ...)
        }
    }
    else {
        matplot(centre[, 1], centre[, 2], col = p.col, ...)
        l = list()
        for (i in 1:length(n)) l[i] = list(seq(0.1, 0.6,
            length = n[i]))
        if (length(l.col) == 1)
            l.col = rep(l.col, length(n))
        r = 1:N
        for (r in r) {
            for (j in 1:length(n)) {
              if (r%%(n[j] + 1) == 0) {
                r1 = 1:n[j]
                l1 = seq(0.1, 0.6, length = n[j])
                for (r1 in r1) {
                  fire(centre = centre[j, ], r = seq(r1 -
                    l1[r1], r1 + l1[r1], length = 10), theta = seq(0,
                    2 * pi, length = 10 * r1) + 1, l.col = par("bg"),
                    lwd = lwd + 2)
                }
              }
              else {
                if (l.col[j] == "red")
                  fire(centre = centre[j, ], r = seq(r%%(n[j] +
                    1) - l[[j]][r%%(n[j] + 1)], r%%(n[j] +
                    1) + l[[j]][r%%(n[j] + 1)], length = 10),
                    theta = seq(0, 2 * pi, length = 10 *
                      r%%(n[j] + 1)) + 1, l.col = rgb(1,
                      r%%(n[j] + 1)/n[j], 0), lwd = lwd,
                    ...)
                else if (l.col[j] == "green")
                  fire(centre = centre[j, ], r = seq(r%%(n[j] +
                    1) - l[[j]][r%%(n[j] + 1)], r%%(n[j] +
                    1) + l[[j]][r%%(n[j] + 1)], length = 10),
                    theta = seq(0, 2 * pi, length = 10 *
                      r%%(n[j] + 1)) + 1, l.col = rgb(1 -
                      r%%(n[j] + 1)/n[j], 1, 0), lwd = lwd,
                    ...)
                else if (l.col[j] == "blue")
                  fire(centre = centre[j, ], r = seq(r%%(n[j] +
                    1) - l[[j]][r%%(n[j] + 1)], r%%(n[j] +
                    1) + l[[j]][r%%(n[j] + 1)], length = 10),
                    theta = seq(0, 2 * pi, length = 10 *
                      r%%(n[j] + 1)) + 1, l.col = rgb(r%%(n[j] +
                      1)/n[j], 0, 1), lwd = lwd, ...)
                else fire(centre = centre[j, ], r = seq(r%%(n[j] +
                  1) - l[[j]][r%%(n[j] + 1)], r%%(n[j] +
                  1) + l[[j]][r%%(n[j] + 1)], length = 10),
                  theta = seq(0, 2 * pi, length = 10 * r%%(n[j] +
                    1)) + 1, l.col = rainbow(n[j])[r%%(n[j] +
                    1)], lwd = lwd, ...)
              }
              ani.pause()
            }
        }
    }
}
card <- function(N = 20, p.col = "green", bgcolour = "black",
    lwd = 5, ...) {
    ani.options(interval = 1)
    for (i in 1:N) {
        par(ann = F, bg = bgcolour, mar = rep(0, 4), pty = "s")
        f(N = i, lwd = lwd, ...)
        text(0, 0, "Happy New Year", srt = 360 * i/N, col = rainbow(N)[i],
            cex = 4.5 * i/N)
        ani.pause()
    }
}
ani.options(interval = 0.2)
card(N = 30, centre = rbind(c(-8, 8), c(8, 10), c(5, 0)),
    n = c(9, 5, 6), pch = 8, p.col = "green", l.col = c("rainbow",
        "red", "green"), xlim = c(-12, 12), ylim = c(-12,
        12))
## R version 3.0.2 (2013-09-25)
## Platform: x86_64-apple-darwin10.8.0 (64-bit)
## Other packages: animation 2.3, picante 1.6-2, nlme
## 3.1-111, FD 1.0-11, vegan 2.0-7, permute 0.7-0,
## geometry 0.3-3, magic 1.5-4, abind 1.4-0, ape 3.0-9,
## ade4 1.5-2